

Brad Edgerly
The Architect, Creative Sparq
Always seeking to understand and improve, Brad is a systems workflow architect that likes to get his hands dirty. Want to know more?
I’m Brad Edgerly and I am a productivity nerd—this means maximizing the output value for every unit of input, and getting more out of what you paid for.
Since I graduated from university, business process has been my favorite tool in my tool kit. I started at PwC in my early 20s, where I was auditing high-risk processes at multinational corporations.
When my reports were delivered to the board of directors; I had to clearly explain how these complex processes worked, risk points, and improvement opportunities. And I loved it, which makes me a little unique.
15 years ago, I started using business process to enable change and transformation at an enterprise telecom company. The result? Comparing my track record to other system implementation projects, a Director at the time said we were “ahead by a country mile.”
Now after 22 years of business process audit, redesign, and re-implementation work, here are 4 things I’ve learned:
Business processes evolve over time. As the business grows and responds to its environment and competitors, quick-fix decisions are usually made in silos without considering the end-to-end-impact. Systems become disjointed.
Phone calls, emails, text messages, and spreadsheets float around the business, outside of managed systems. You can’t report on them and it’s difficult to access them.
Errors increase. Productivity declines.
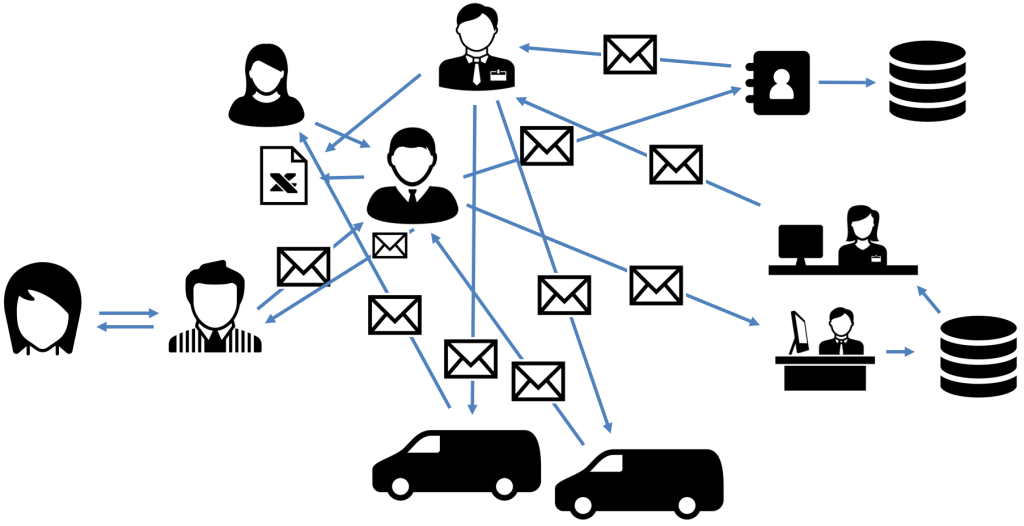
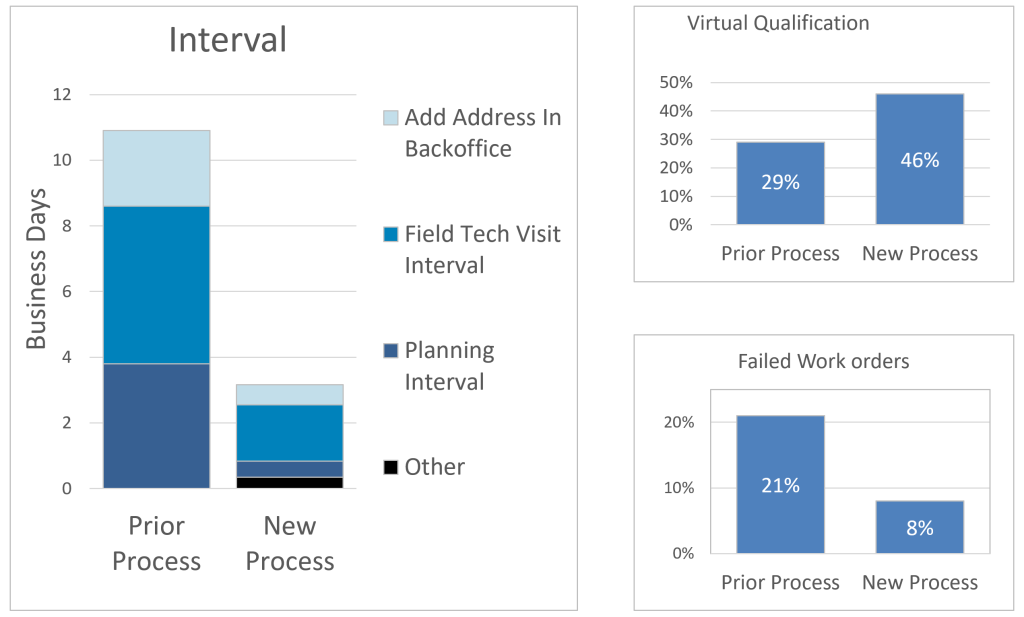
When working for the growing telecom, site visit requests were routed to a shared mailbox and monitored by order coordinators, who tracked details in spreadsheets.
Key reports were produced weekly and monthly by a team who mashed datasets together, which proved to be error prone. KPI’s weren’t readily available; this meant decision making was negatively impacted
We redesigned workflow and made adjustments to how the systems were set up. Our return on investment was huge—1,450% and $6 million in savings in the first year alone, from $390,000 project costs. It earned us a standing ovation on launch day.
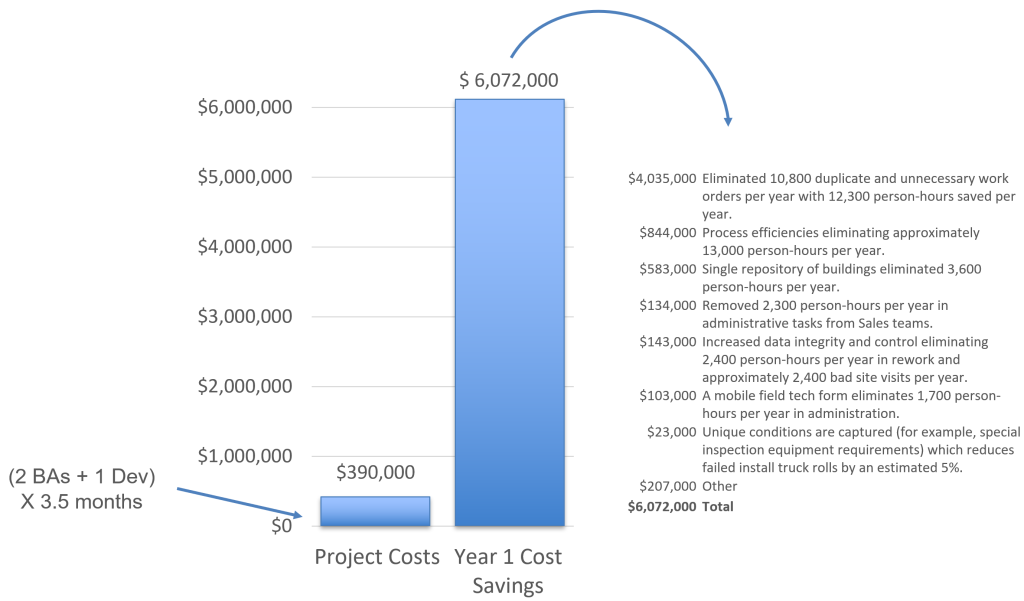
We eliminated shared mailboxes, eliminated spreadsheets, and integrated processes into Salesforce CRM to reduce inefficiencies.
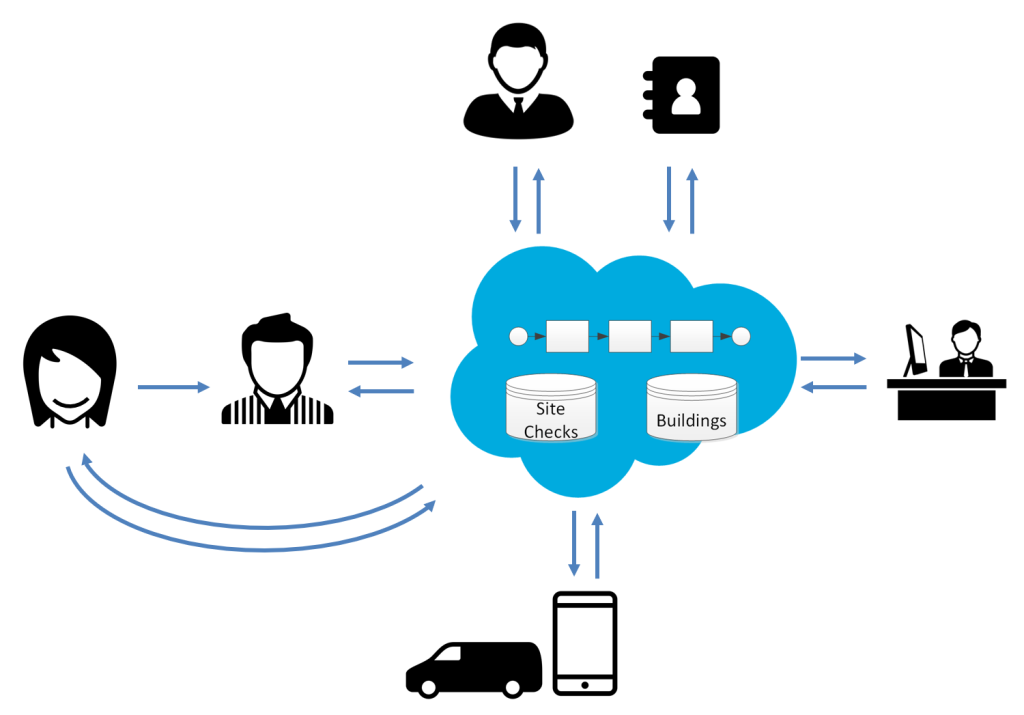
Data was now real-time, reliable, and accurate. Errors and fallout evaporated. Asset utilization was improved by reducing unnecessary “truck rolls”, so we could redeploy technicians to focus on customer activations (and revenue increases) instead.
On launch day, the users gave our team a standing ovation. That felt pretty awesome.
Have you ever talked to someone about business process at a dinner party? I have. I’m passionate about it! But I carry the conversation.
Most people agree that business process is important, but most individual contributors only know their part of a process. Managers know their process and how to interface with neighboring teams.
But no one person knows how it all fits together, either because of lack of ability, capacity, or interest.
It’s hard to know where to start and it can be daunting to navigate through complex business processes.
After experimenting with many different approaches in the last 2 decades, I’ve figured out the right approach that makes it all easier.
We create information-rich workflow diagrams that are easy for everyone to read and understand, with simple icons.
When it’s easier to understand how all the different pieces connect:
- Project risks are minimized
- Troubleshooting gets easier
- Roles become clearer
- Collaboration improves
- Onboarding is quicker
- Everyone finally knows how their efforts contribute to, and impact, the business
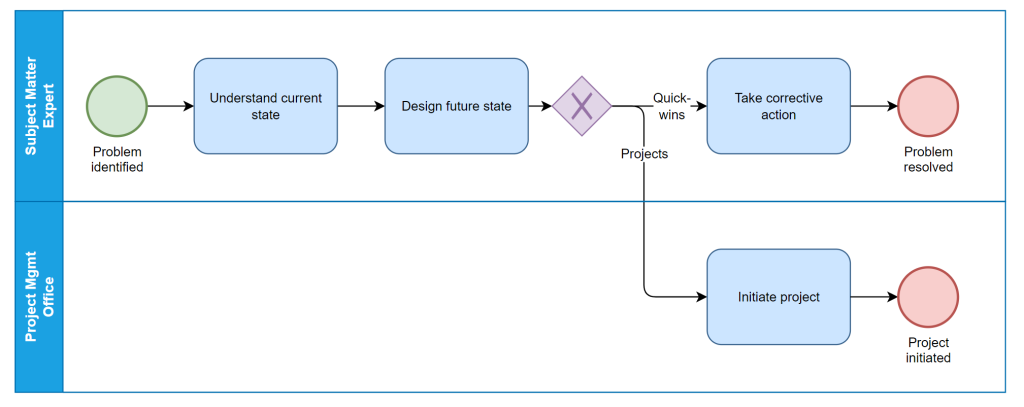
If you have a tangly and convoluted process that causes confusion and friction in your organization, start by interviewing stakeholders and document what they say using these simple icons and shapes:
- Boxes to represent activities that people or systems do in the form of “[verb] [noun]”. For example: “create report”, “sign contract”, “approve expense”, etc.
- Arrows to signify workflow.
- Circles to signify events. For example: “report created”, “contract signed”, expense approved”, etc.
- Lanes (advanced) to highlight how the process moves between individuals, teams, or systems.
Here’s a process diagram you can reference:
Engage a partner you can trust.
Want someone who knows the terrain to show you all the shortcuts?
Enter your information and you’ll receive a link to book an architect for a free 45-minute assessment to see how we can maximize productivity at your organization.